
This activity is part of the Citilab Course. Check it out!
Bubble Level
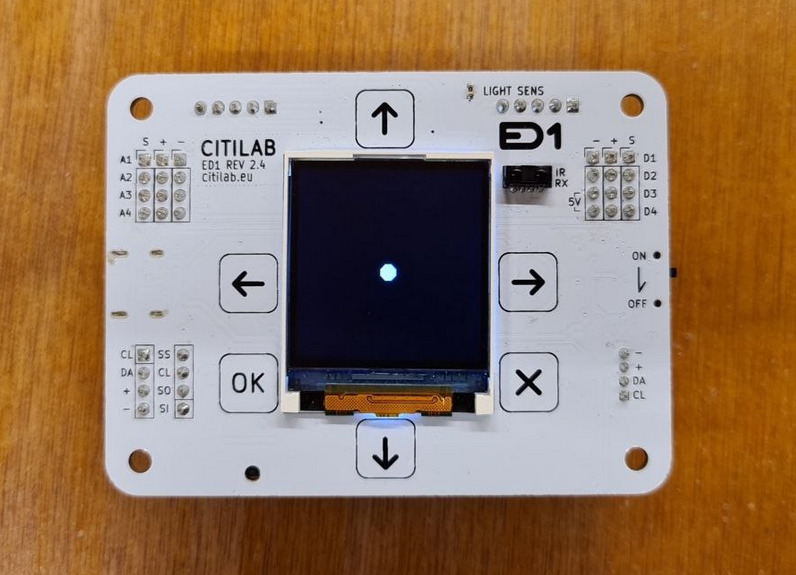
Accelerometer
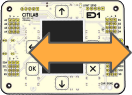
- Another sensor that the board has is the accelerometer. With this sensor we can know the inclination of the board in any of the three axes (X,Y and Z).
- The range of values in these is from -100 to 100, giving 0 in the X and Y axes if the board is completely flat with respect to the floor.
| X | Y |
|---|---|
 |
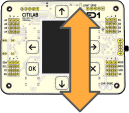 |
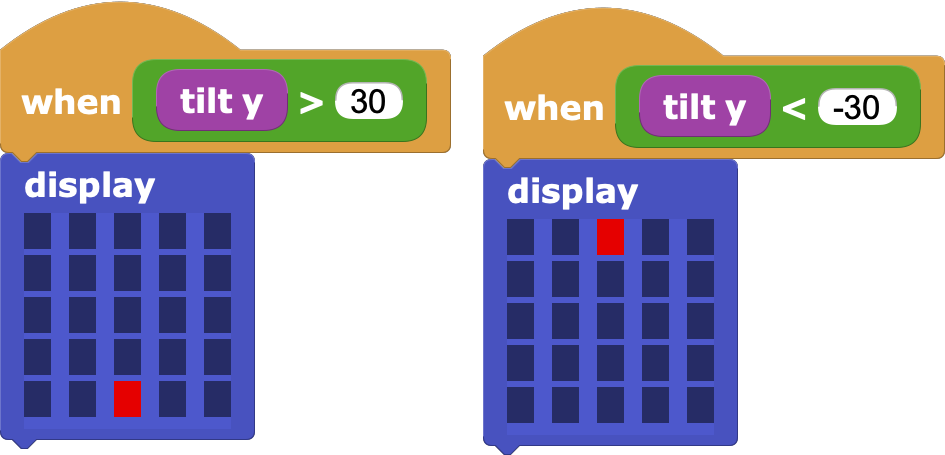
Challenge 1: Try to do the same but with the Y axis, i.e. by drawing a point towards the side where the board is tilted

Solution to challenge 1
Value mapping
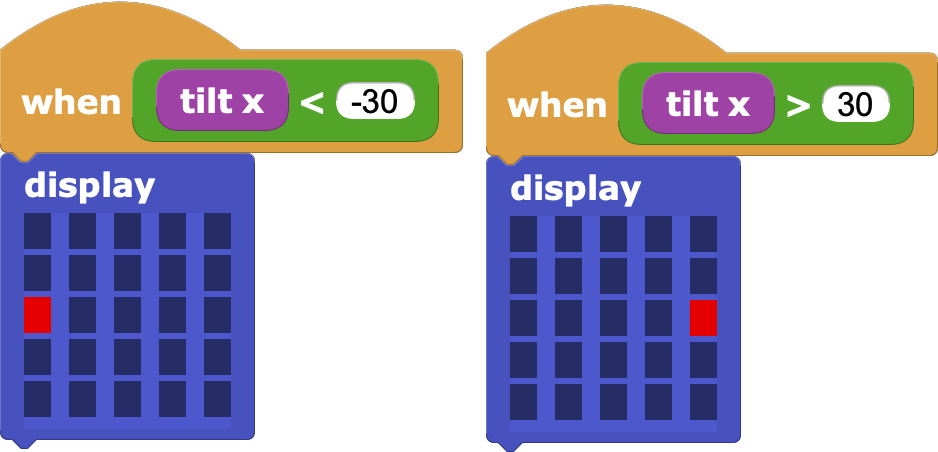
- If we now wanted to make any point on the screen light up depending on the X and Y tilt, we would need 25 blocks similar to the ones we just made!
- We can think of a more efficient solution by looking at mapping (converting from one range to another) the value of the inclination in X and Y with the row and column number of the LED to turn on.
| Tilt (X or Y) | LED (X or Y) |
|---|---|
| -100 | 1 |
| -50 | 2 |
| 0 | 3 |
| 50 | 4 |
| 100 | 5 |
- In this way we would only need the
plot x _ y _andunplot x _ y _blocks to control the LEDs.

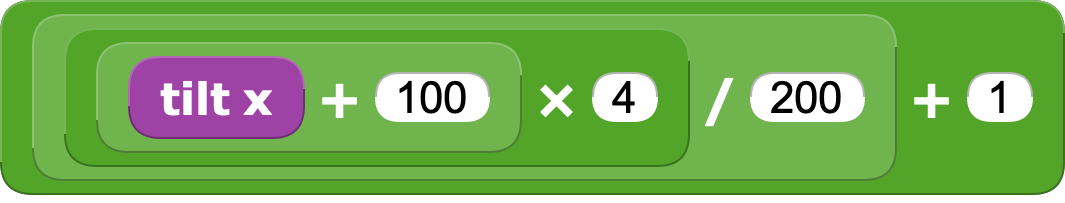
Challenge 2: Find the formula to transform the X or Y slope value (-100 to 100) to a screen row or column value (1 to 5)
Solution to challenge 2
Turn LEDs on and off
- Now that we have the formula, we can use it to turn on an LED and also turn it off immediately (since otherwise they would all stay on!).
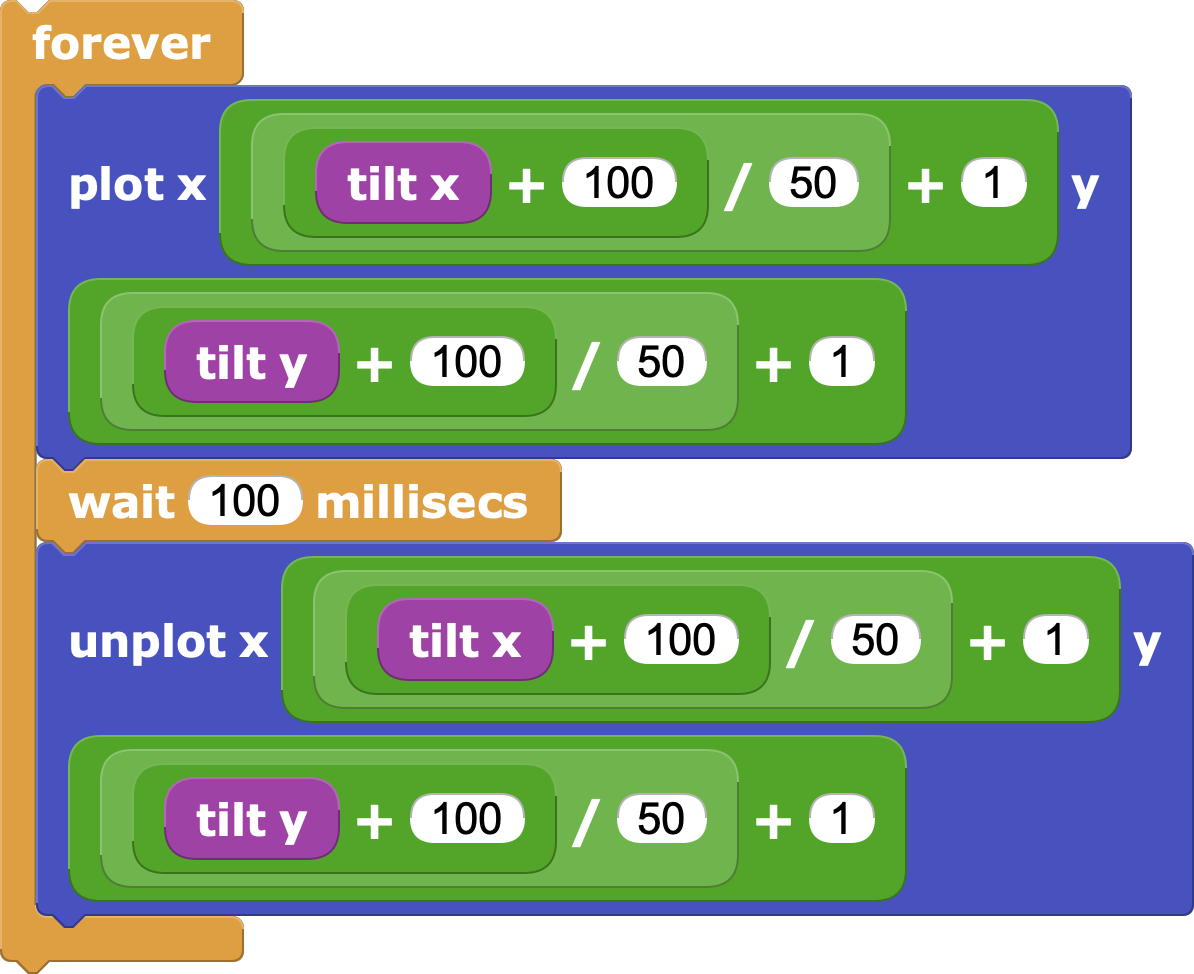
- If we test it, we will see that we have this problem anyway, since it is possible that the same LED does not turn on and off (the tilt value between one block and the other can vary!).
- For this reason we should save somewhere the value resulting from the formula, and that is why the variables are there.
Variables
- They serve to temporarily save a value during the execution of a program.
- First we will create a variable to save the x value, by going to the Variables category and pressing the Add a variable button. We will repeat the same process to create the variable to store the y.
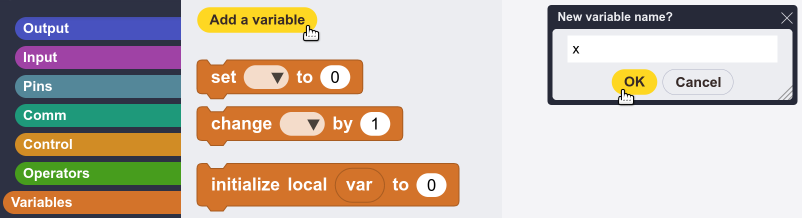
Finally, you only need to use the set _ to _ block to save the formulas corresponding to the variables.
TFT Library
- We can go further by improving the display of the bubble, using the TFT library available in the Graphics and Displays folder.
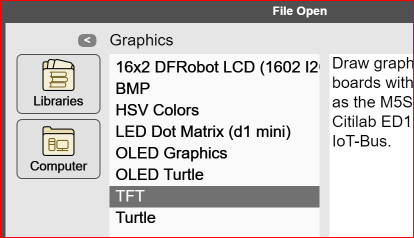
- This library offers different blocks to represent geometric shapes, in addition to text.
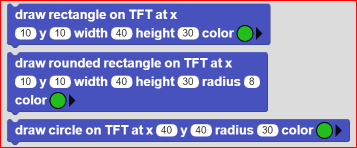
- In our case we can use the rectangle or the circle to represent the bubble, with which we can configure its size and color.
Value mapping (II)
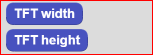
- Now we no longer need the formula we used before, since now we can use any pixel on the screen.
- Although the ED1 screen is 128x128 pixels, we can use the "TFT width" and "TFT height" blocks in case we don't know what size it is or also if we serve another different board.
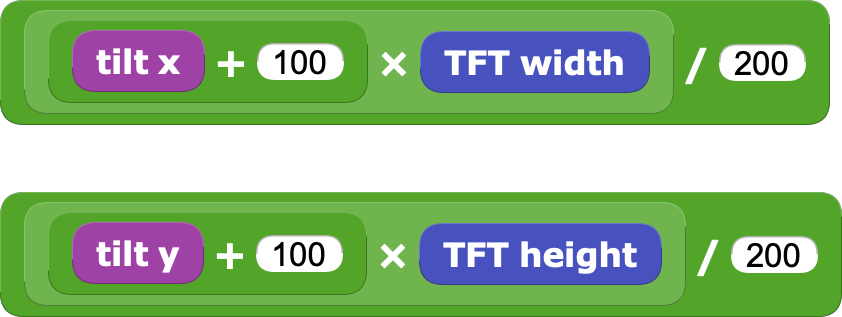
Challenge 3: Find the formula to transform the X or Y slope value (-100 to 100) to a screen row or column value (1 to 5)
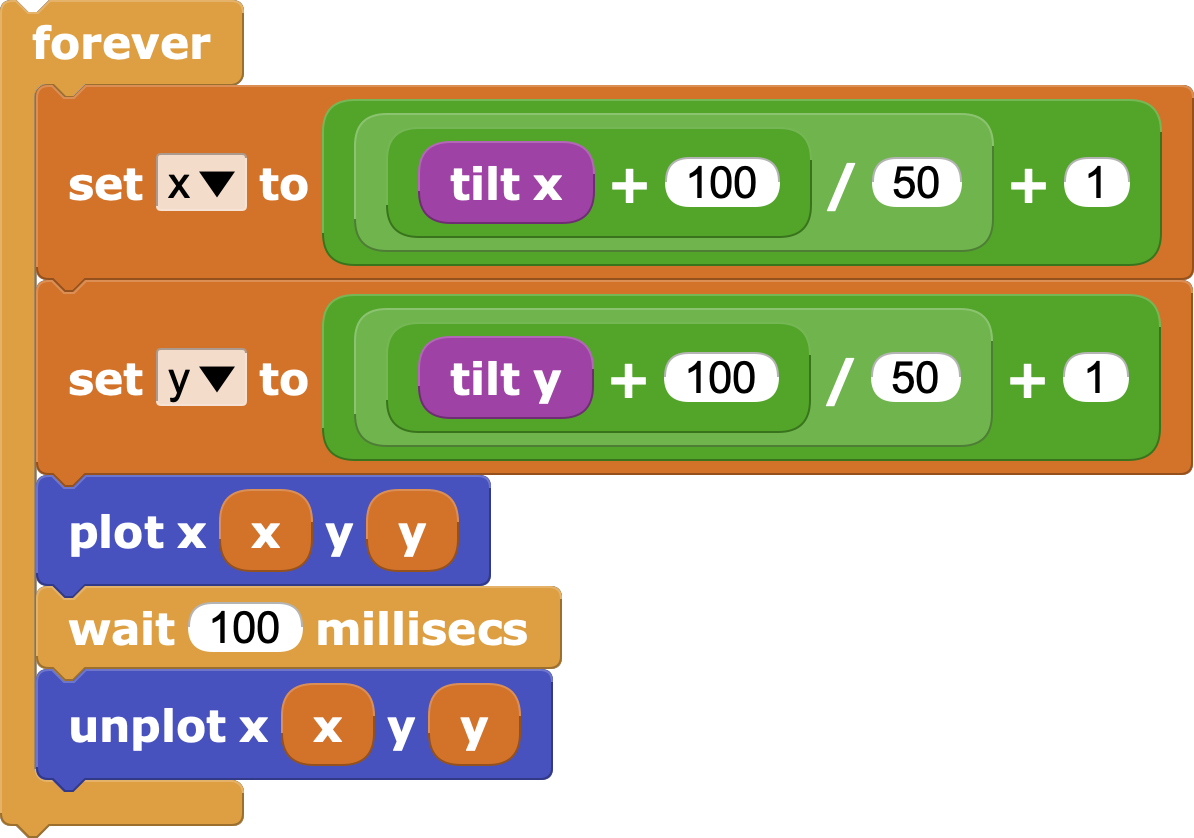
Solution to challenge 3
Draw bubble
- As in the previous case, we will have to save each formula in the corresponding variable.
- If we use the draw circle block, we only need to specify its radius and color. Once drawn, we can "erase" it by drawing it again but in black.
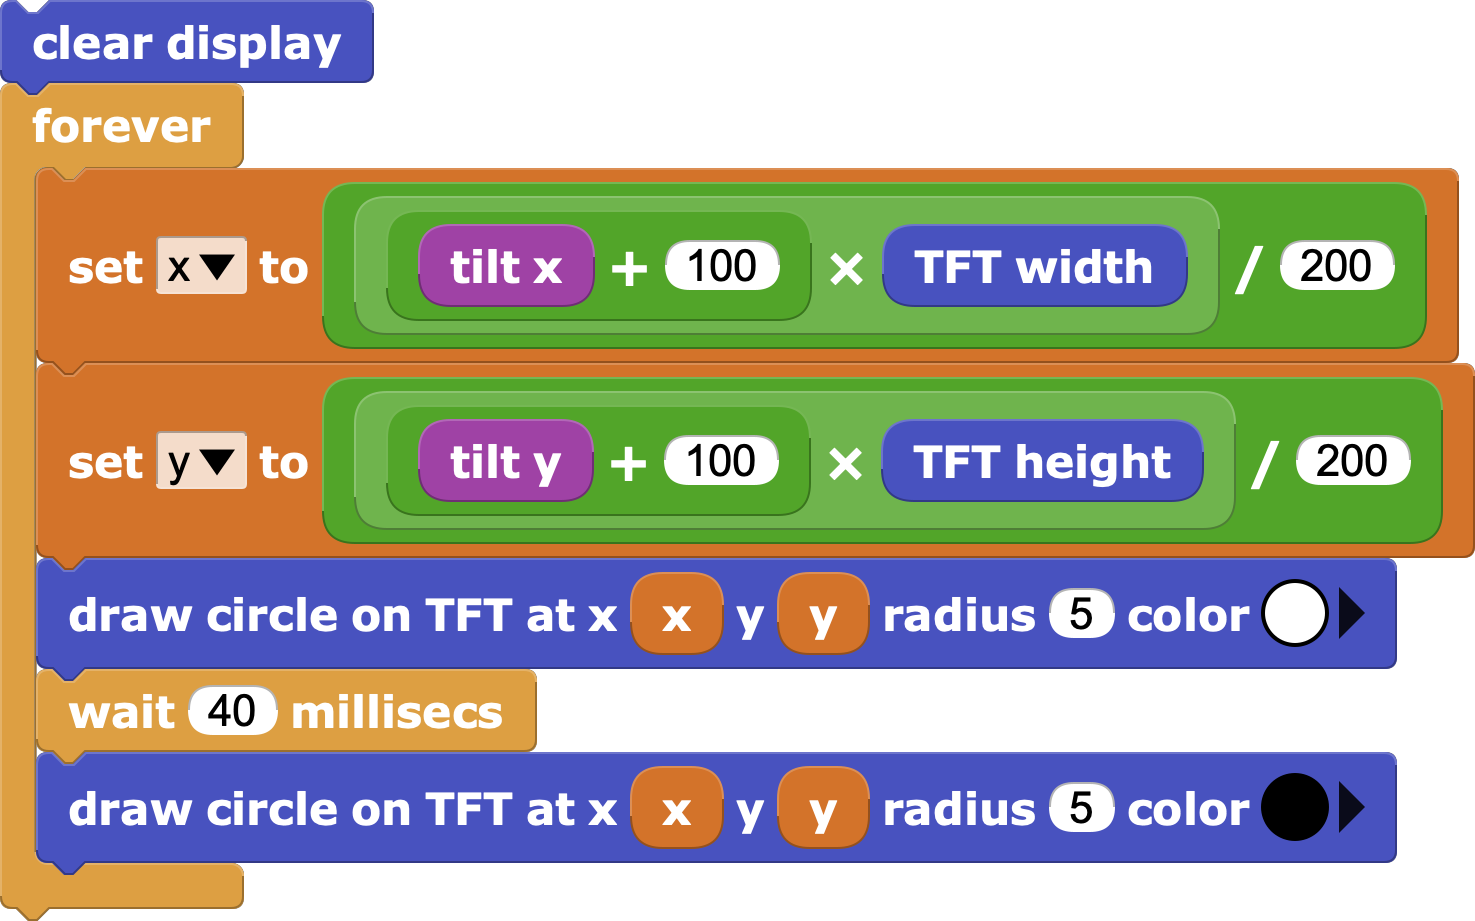
- It is recommended to clear the screen first, as this way we make sure that there will be nothing that could have been drawn before.
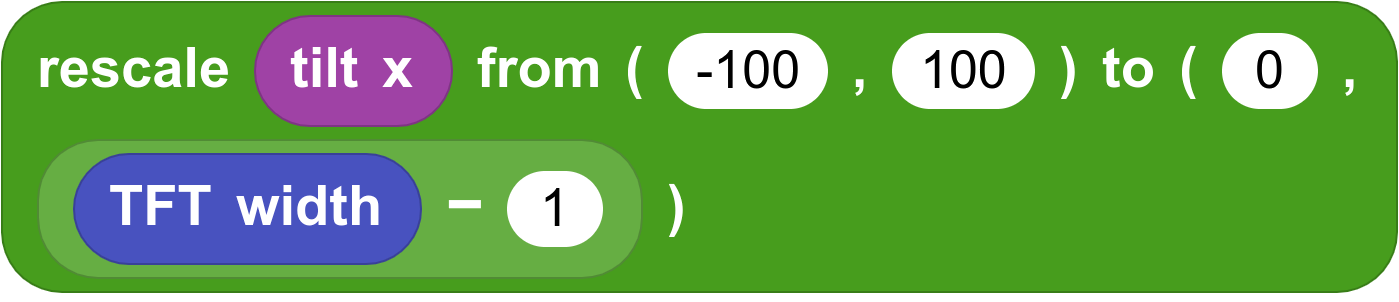
Rescaling
The rescaling operation is common when you want to go from one range of values to another.
That's why microBlocks includes a block that does it automatically. It is necessary to activate advanced mode in the configuration menu ![]() .
.

This activity is part of the Citilab Course.
| ⬅️ Previous activity | Next activity ➡️ |
|---|
© von Citilab Edutec 2019-2025.
This work is licensed under a CC-BY-SA 4.0 license.